by Mayla Hsu, Ph.D., Director of Research and Science, GLA
“Tickpocalypse!” “The Year of the Tick!” “A Tick-ing Time Bomb!” These are all recent clickbait headlines that cause us fear and anxiety. But how do we realistically and reasonably know the risk of acquiring tick-borne diseases? How can we anticipate that ticks will be in our neighborhoods?
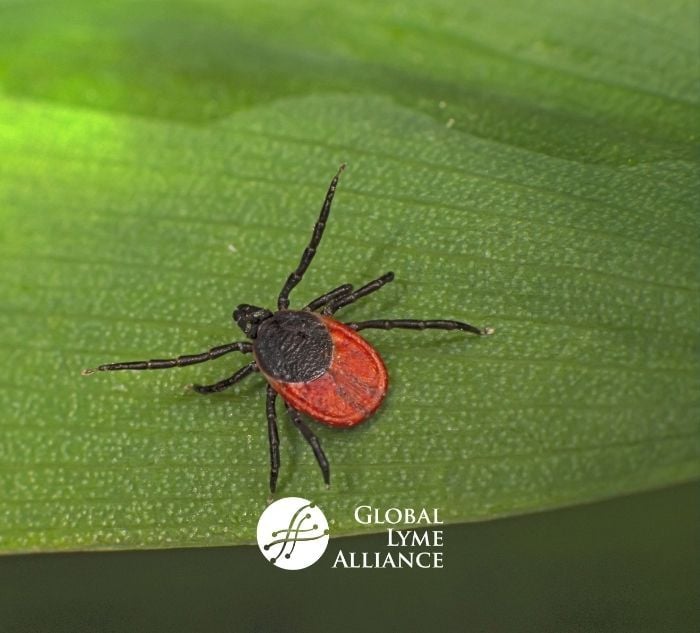
There’s no doubt that Lyme disease and other illnesses spread by ticks are on the increase. As might be expected, climate change, land and habitat management, and human behavior are all variables that affect the degree of risk. The Centers for Disease Control and Prevention (CDC) has found that the geographic range of ticks is expanding, with the principal vector of Lyme disease, Ixodes or black-legged tick, now found in 49% of all US counties. The CDC has also shown that the number of counties with high Lyme disease incidence is growing. If areas previously unknown for ticks become suitable habitats for them, which is now occurring, we will need surveillance strategies that will dependably inform public awareness and prevention programs.
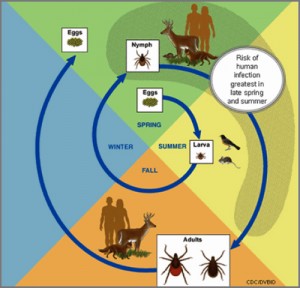 More than 40 years after Lyme disease was first identified, we now know that the life cycle of ticks depends on host species that provide the three blood meals needed for a tick’s major life transitions: (1) from larva to nymph, then (2) nymph to adult, and (3) so adult females can lay eggs. Small mammals like mice and chipmunks, as well as birds, deer and other animals are all host species for ticks. When not “questing”, or awaiting passing hosts from the tops of blades of grass, and when not attached to host animals, ticks are on the ground, where they spend most of their time.
We can measure tick abundance by directly counting ticks caught in traps or by cloth dragging, and identifying the tick species caught. Advantages to this are relative ease and lack of expensive technology. However, cloth dragging on the ground may be obscured by dense vegetation or trees. Another obvious limitation is that dragging may not sample large enough geographic areas. In addition, transient environmental variables like weather changes or time of day can affect tick trapping and drag capture outcomes.
Surveying animals is another way to measure tick prevalence. This can include counting ticks from domestic livestock or pets, or trapping wild animals such as mice. Wild host species can potentially serve as “sentinel” species, indicating tick abundance in the host’s native habitat. Generally, a good sentinel species would be an animal that can be caught and sampled readily, has a predictable geographic range, and is attractive to ticks. An example is the white-tailed deer, in which tick burden and pathogen load has been successfully studied in hunted animals.
Another example is wild pigs, whose large range can span various habitat types, and who can host varying species of ticks. In a recent study of 316 wild pigs in Florida, 1,023 adult ticks and only one nymph tick were collected. In contrast, 39 adults, 150 nymphs, and 2,808 larvae were found from dragging. This difference is likely because immature stages of ticks tend to quest lower than adults. Thus, larvae and nymphs are more likely to found than adults by dragging survey. In contrast, adult ticks may be more likely to be detected on hosts that have a medium to large body mass. Overall, these results suggest that complementary information was available from the two sampling methods. Together, cloth drags and sentinel species gave more complete information about tick abundance than each done separately.
With field data from cloth dragging and sentinel species, mathematical models can be built to predict whether tick populations in local neighborhoods are expected to be high or low. These calculations add data on elevation and weather patterns, including humidity, daily and seasonal temperature fluctuations, and precipitation. The type of habitats, whether agricultural, grassland, or forest, all composed of varying vegetation types, are also included in models.
Mathematical models were used to identify the highest densities of host-seeking nymph ticks in Minnesota. The study’s authors found that tick density increased as the proportion of agricultural land decreased, with the highest risk of host-seeking nymph ticks in the Minneapolis-St. Paul metropolitan area. Large swathes of western and southern Minnesota were found to be unsuitable for ticks, perhaps because such large rural areas are lacking in potential tick hosts. They also found that extremes of temperature and precipitation were identified as predictors of tick density.
Climate change will play a big role in tick habit expansion, with reports of ticks now emerging in Canada. Specialized mathematical models known as climate envelope models predict suitable new habitats for species. This type of model was used to determine whether a newly invasive tick, Haemaphysalis longicornis, would be predicted to expand in New Zealand. It was calculated that 75% of cattle farms in North Island and 3% of those in South Island will be suitable habitats for this tick, a concern because it transmits cattle anemia. This information will be important for gearing policy toward tick surveillance and reduction.
Ticks are an important concern for public health, environmental management, and agriculture. Only with reliable and valid research will we be able to accurately describe and anticipate future tick threats. This will be a rational first step toward effective control.
 Mayla Hsu, Ph.D.
Director, Research and Science
Global Lyme Alliance
Mayla manages GLA’s research grant program, working with the Scientific Advisory Board and creating viable partnerships to help advance the development of a reliable diagnostic test, effective treatments and ultimately a cure for Lyme.